Table of Contents
User Guide for the Visualization Component
ComponentVisualization is a 3D visualization component. It is used to visualize communication objects like a base pose, a laser scan, a RGBD image, a RGB image, a depth image, etc.
It uses the MRPT library and the source code of ComponentVisualization is available here.
To use ComponentVisualization in a system, it must be added to the corresponding system project. Upon starting the system, ComponentVisualization then starts along with the other components used in the system.
Adding the Visualization Component to a System Project
Adding ComponentVisualization to a system project is similar to adding any other SmartSoft component Ref.
- Step 1: Import
ComponentVisualizationinto the system project. - Step 2: Add instance
ComponentVisualizationto the system architecture.
Refer to Step 1.c of the tutorial on Develop Your First System.
Do not connect ports of ComponentVisualization to ports of any other component. The visualization component dynamically and automatically connects at run-time to the components according to your selected visualizations.
- Step 3: Add instance
ComponentVisualizationinto the system architecture.
Refer to Step 3.g and Step 3.h of the tutorial on Develop Your First System. - Step 4: Deploy and Execute the system.
Refer to Step 5 of the tutorial on Develop Your First System.
Using the Visualization Component
ComponentVisualization has client ports which must be connected/wired to server ports to start visualizing the communication objects.
And the client port must be disconnected to stop visualizing the communication objects.
This connection and disconnection can be done either manually or by using skills in the Behavior project.
This section describes connecting and disconnecting ports manually only. Advanced user can use skills to connect and disconnect the client port of ComponentVisualization in runtime.
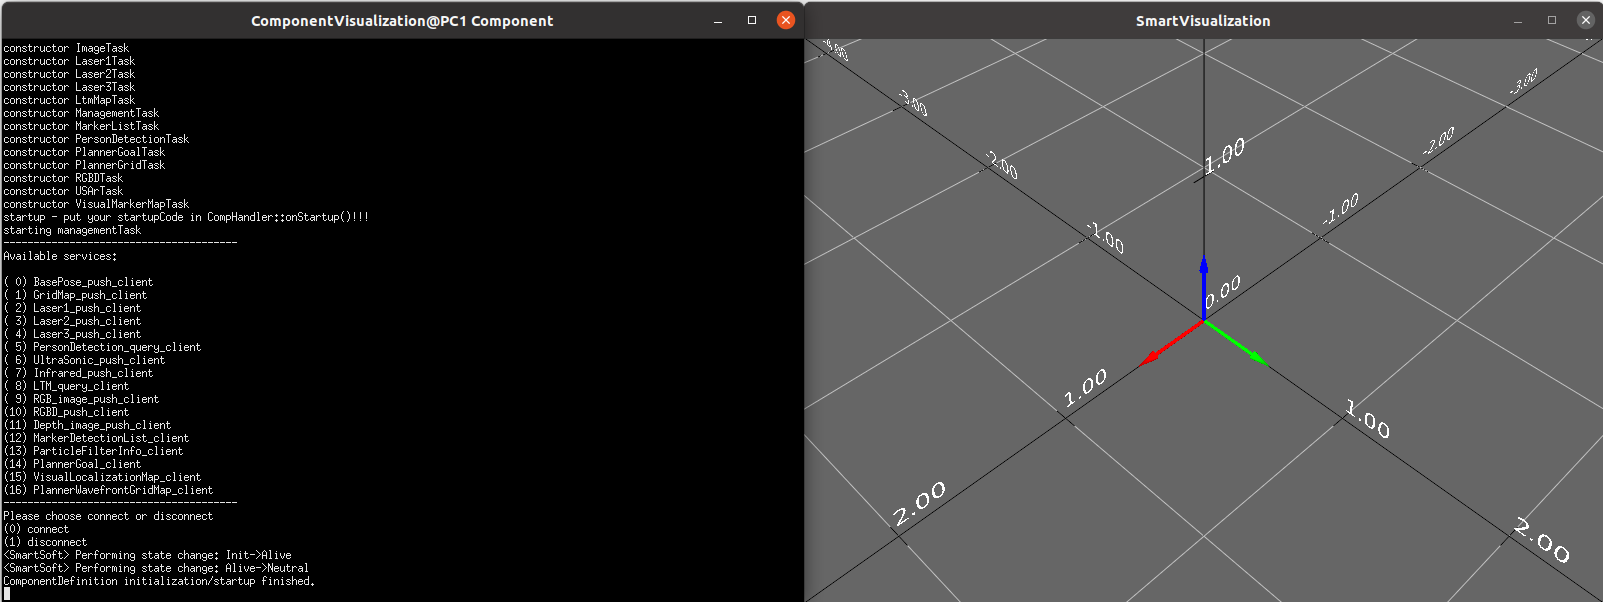
Upon executing the system, ComponentVisualization starts and you can see the ComponentVisualization terminal and SmartVisualization window as shown below:
ComponentVisualization terminal lists the available visualization possibilities (i.e client ports which receive data and visualizes them) and prompts the user to select the option connect or disconnect.
Start the Visualization of a Communication Object
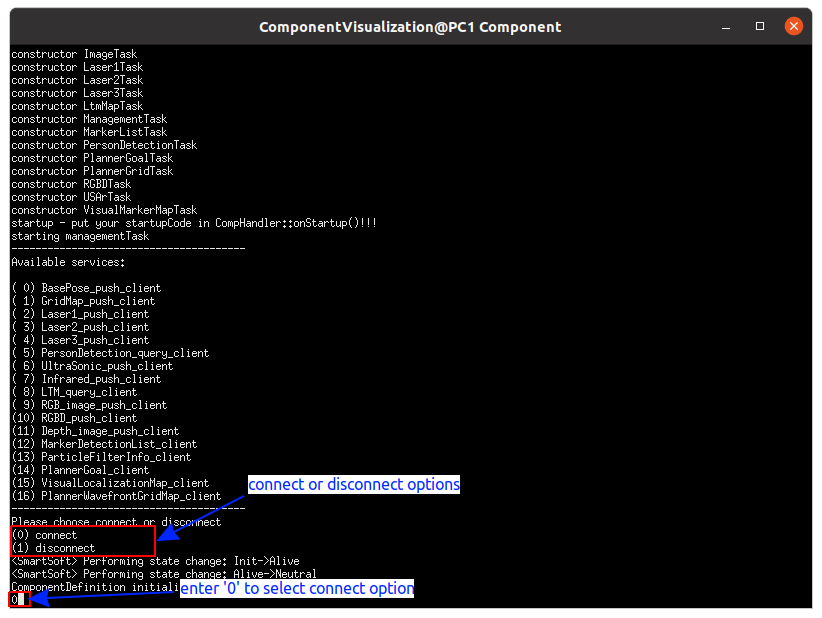
- Step 1: Select the connect option to start visualizing a communication object.
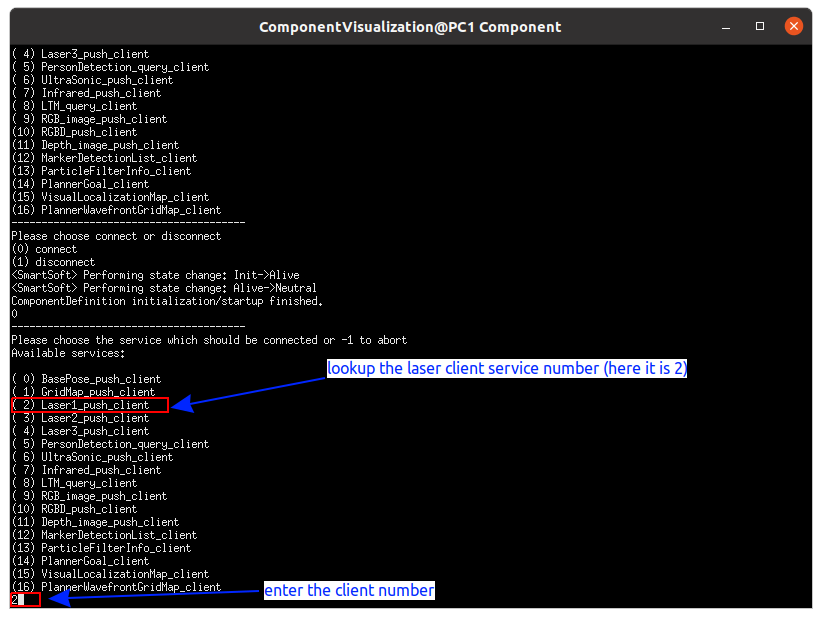
- Step 2: Select one of the listed client ports which is not already connected. ComponentVisualization looks up the naming service and lists the matching server ports(i.e which sends data) if any and prompts the user to select one of the sever port.
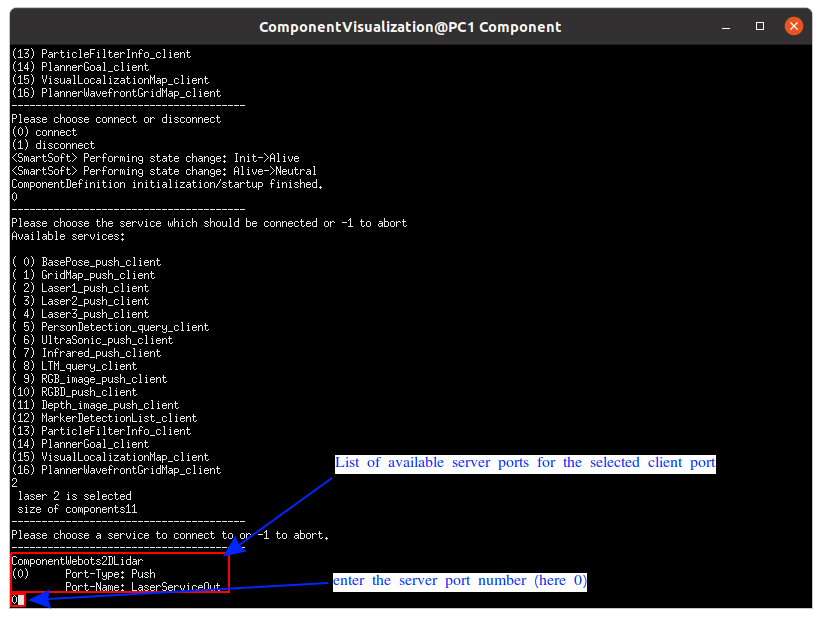
- Step 3: Select one of the server ports, ComponentVisualization connects the client port to server port, receives data and visualizes the data.
Communication objects except RGB and depth images are visualized in the SmartVisualization window. In case of RGB and depth image visualization, a new window will be opened where the image is displayed.
Stop the Visualization of a Communication Object
- Step 1: Select the disconnect option to stop visualizing a communication object.
- Step 2: Select the client port which is to be disconnected.
Example 1
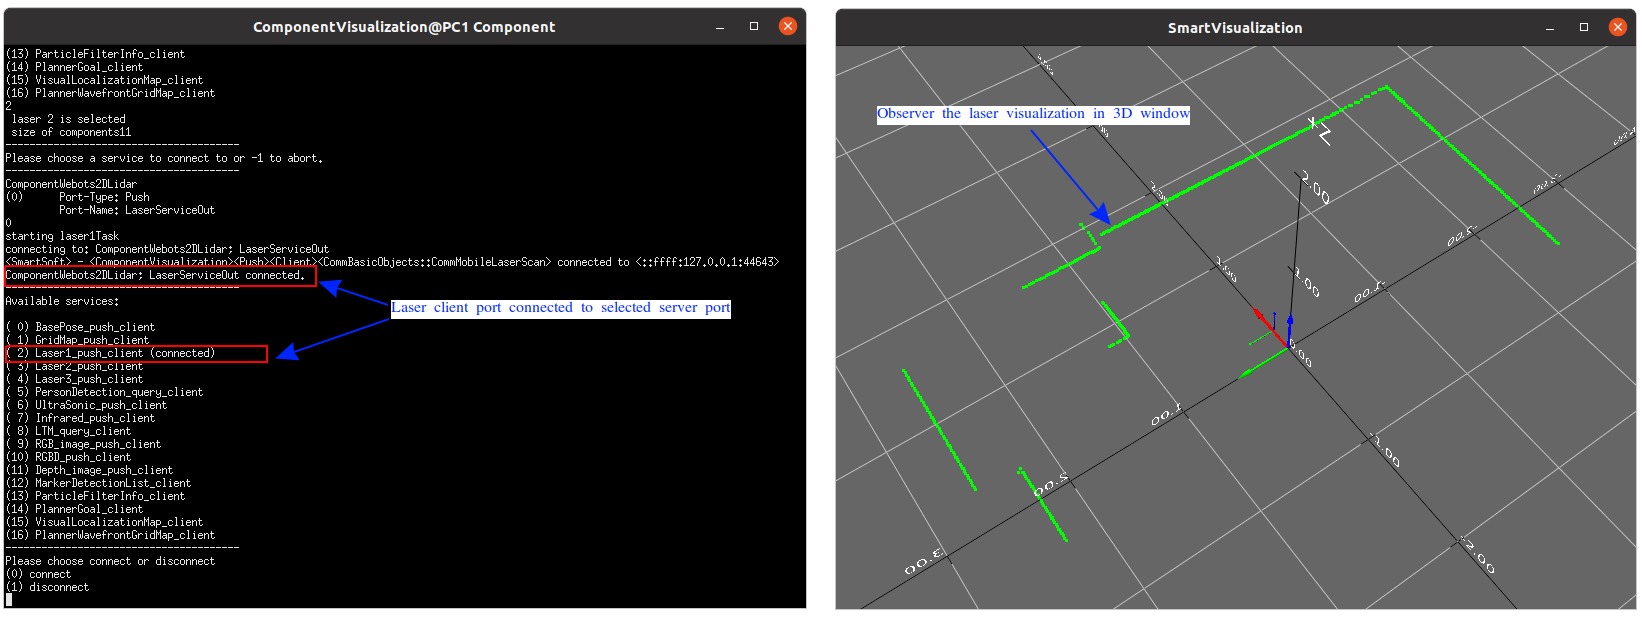
We show how to start and stop visualizing the laser scan in example system project SystemWebotsRobotino3Navigation. Deploy and execute the system. Find the terminal of ComponentVisualization.
Start the Visualization of a Laser Scan
In the terminal of ComponentVisualization, select the connect option.
Select the laser client.
Select one of the listed server ports.
Now laser client port is connected and start visualizing the received laser scans. Observe the visualization window.
Stop the Visualization of a Laser Scan
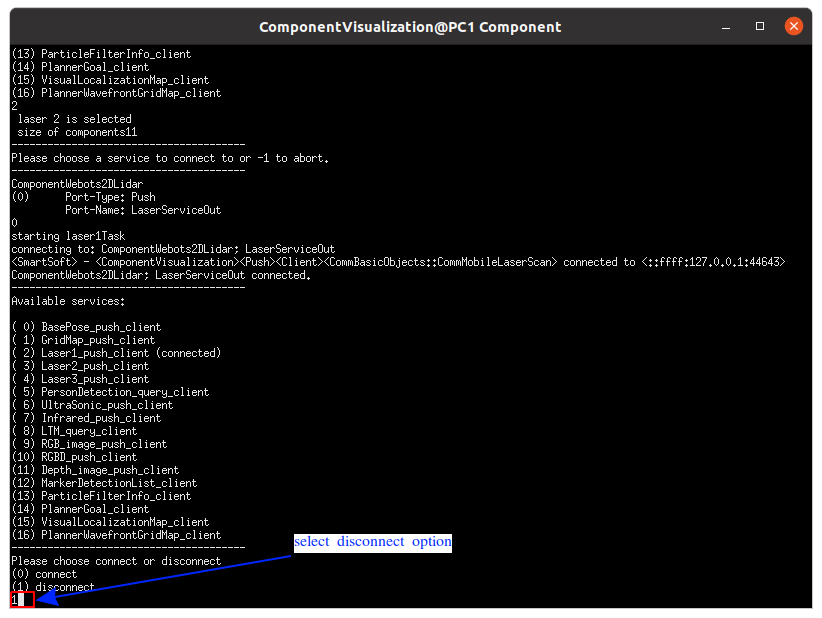
In the terminal of ComponentVisualization, select the disconnect option.
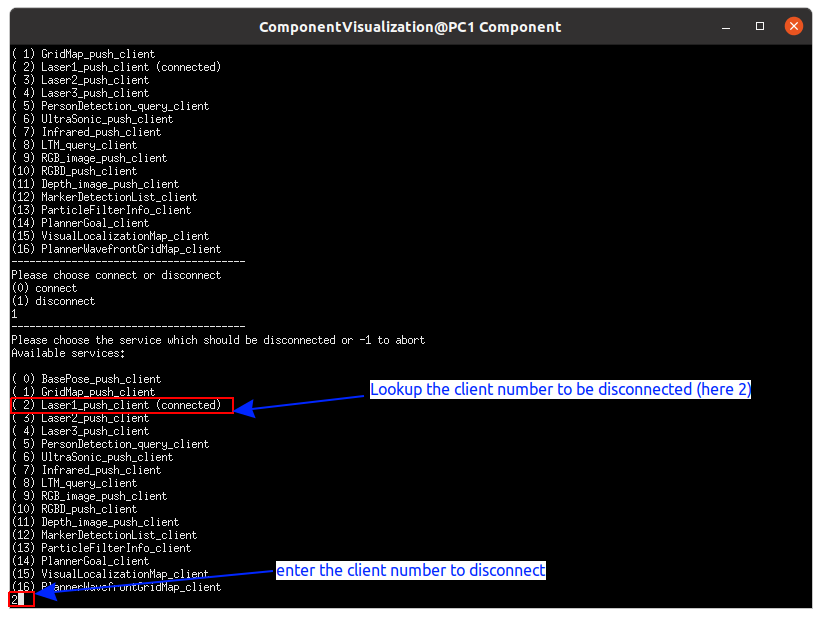
Select the client, which you want to disconnect.
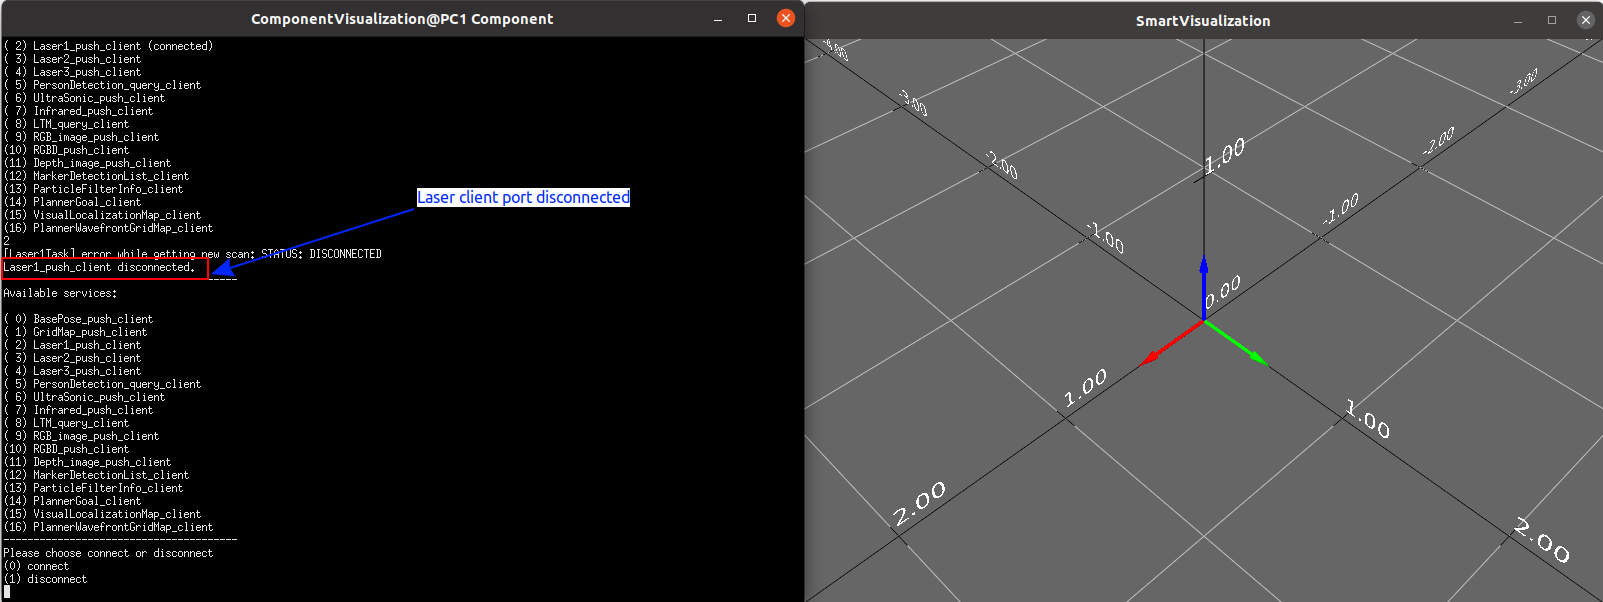
Now the laser client is disconnected and observe the visualization window.
Example 2
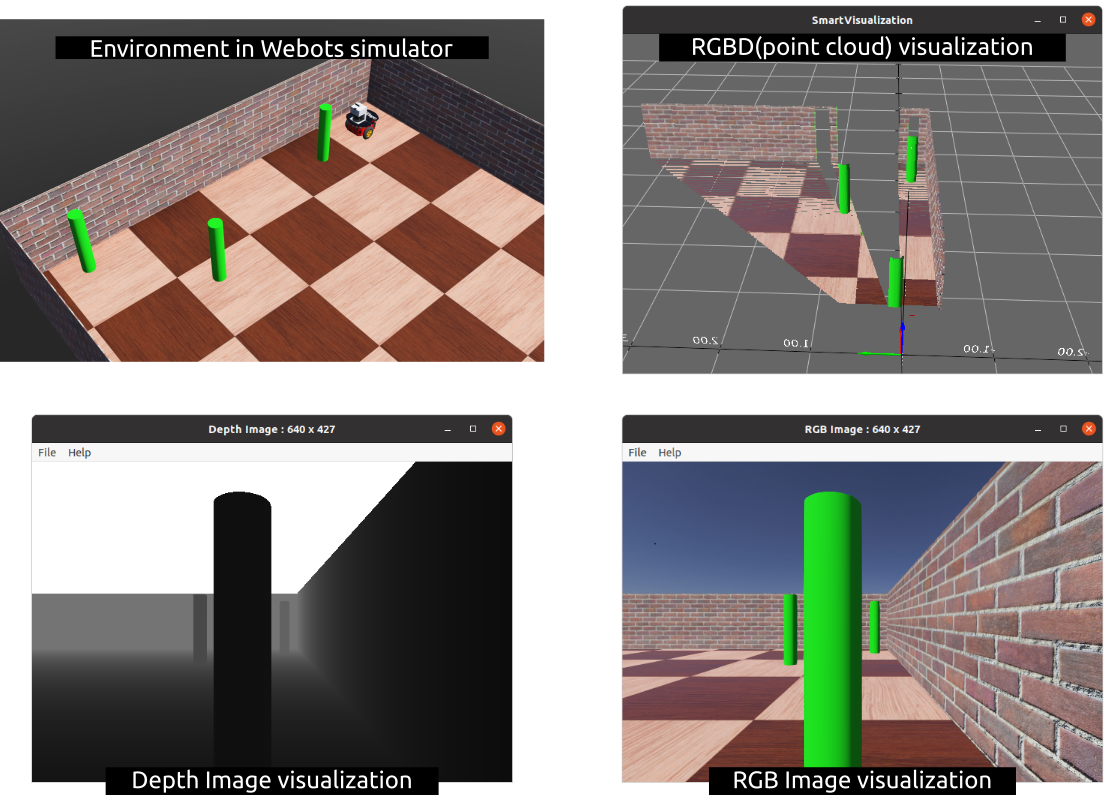
The following picture show a environment from webots and the visualization of RGBD(point cloud), RGB, Depth images using ComponentVisualization.
Interacting with the 3D Visualization Window
Visualization window is based on MRPT library and use the following controls to move around the window.
- Orbit camera: Left-button pressed + mouse move.
- Zoom in / out:
- Mouse scroll wheel, or
- SHIFT+Left-button pressed + mouse move up/down.
- Look around (pivot camera): CTRL + Left-button pressed + mouse move up/down.
- Pan (XY plane): Right-button pressed + mouse move.
- Move camera along Z axis: SHIFT + scroll wheel for faster up/down vertical motion.
Acknowledgment
Nayabrasul Shaik

